
Path Completion Report
- Applies to:
- MindTouch (current)
- Role required:
- Admin
The Path Completion Report helps you understand user engagement within your Expert Paths. It allows you to see most or least popular paths so that you can ensure that every piece of content provides value along the customer journey.
Learn more about the Path Completion report
Access Path Completion report
Navigate to Site tools > Dashboard > Customer Experience Reports > Path Completion.
- The Path Completion report can be accessed by Admins
- The report includes export options to download or email the data.
Report components
The Path Completion report includes two main Dashboard views:
- Path Completion Overview
- Path Completion Details
Export options
All of the export options can be found in the Dashboard Actions menu
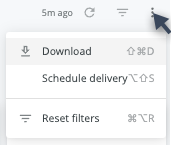
- Download as:
- CSV
- Schedule Delivery (email reports right away or on a schedule)
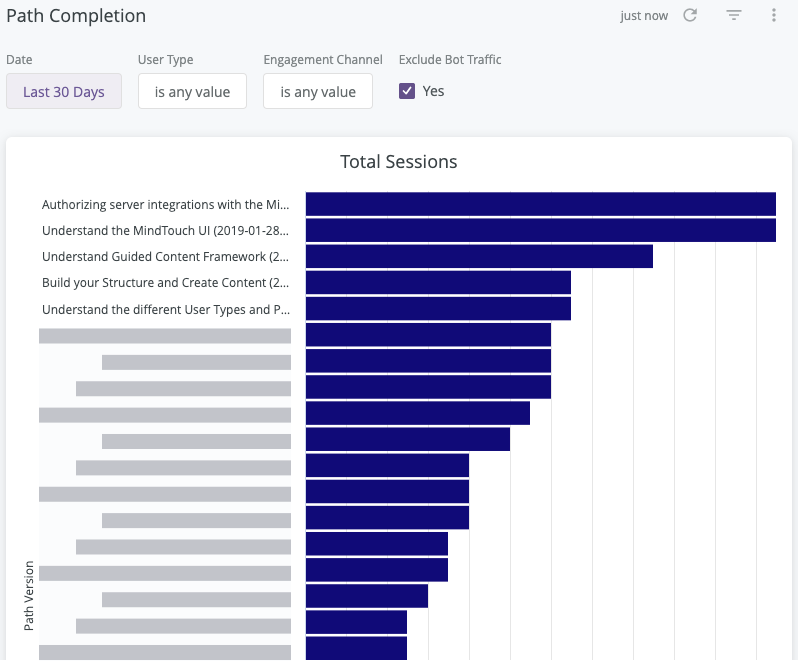
Path Completion Overview
The Path Completion report loads with a Total Sessions overview that shows:
- Bar chart for all Paths that were clicked within the specified time period (past 30 days by default)
- Full Path name and timestamp for version of the Path
- Filter options for Date, User Type, Engagement, Exclude Bot Traffic
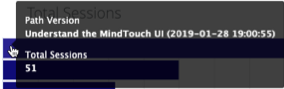
From the Total Sessions bar chart:
- Hover over a Path bar to see the full Path title and version timestamp and Total Sessions count
- Click a Path bar and select Show All [count] to see a data table of the Path clicks for that Path
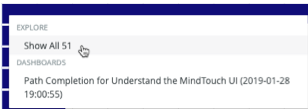
- Click a Path name and select Dashboards > Path Completion for [Path Title (version timestamp)] to see Path Completion Details for that Path
Path Completion Details
Filters and Reload
- Date
- Path Name
- User Type
- Engagement Channel
- Exclude Bot Traffic
- Reload button

- Show/Hide filters

- Reset filters option (located in the Dashboard Actions menu)
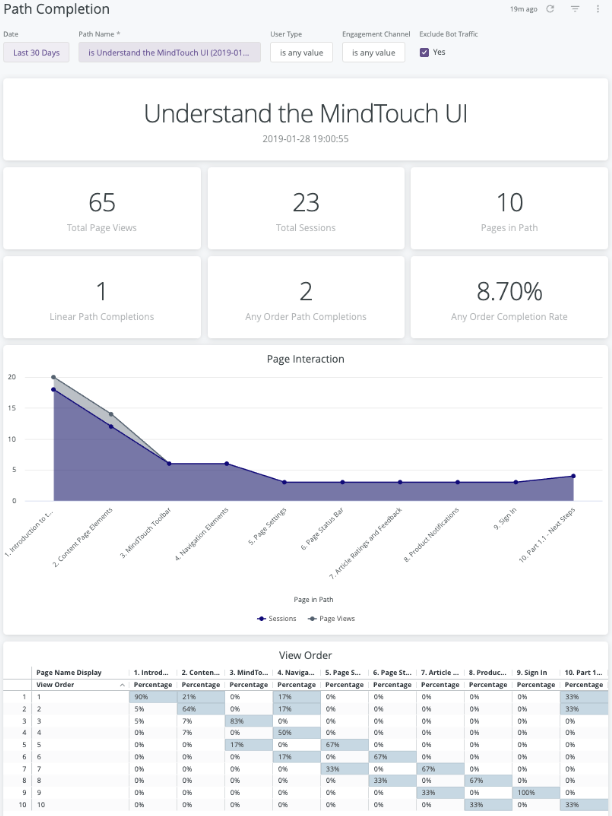
Path Title
Format: Title and last revision timestamp
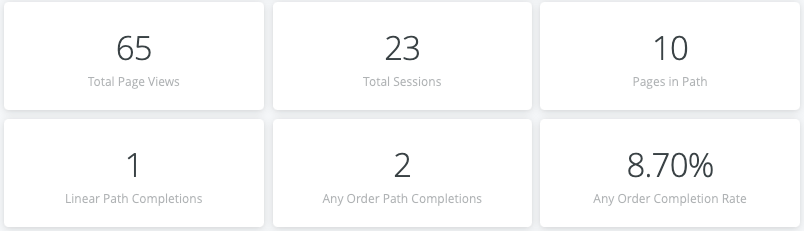
Path Events Summary
Format: Tiles of Total Page Views, Total Sessions, Pages in Path, Linear Path Completions, Any Order Path Completions, Any Order Completion Rate
Interaction options:
- Click any of the tile numbers to see a data table of events by date
- Hover over a tile to show and click 3 dots menu for Download Data options
Page Interaction
Format: Area chart of Sessions and Page Views for each page in the Path
Interaction options:
- Click the Sessions or Page Views labels to toggle them off or on in the chart
- Hover over any plot point to see Page title and Sessions or Page Views count
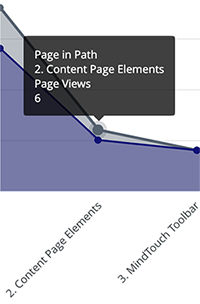
- Click any plot point to see a data table of events by date
- Hover to show and click 3 dots menu for Download Data options
View Order
Format: Data table of percentages of users who viewed each page in a Path and what order they viewed them in.
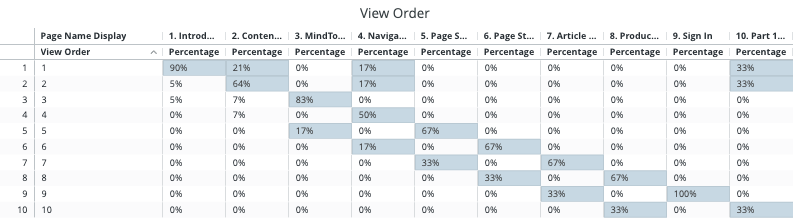
- Vertical Axis: Steps in total Path. At which step in the path was the page viewed.
- Horizontal Axis: Pages in total Path. What percent of people viewed that page during that step of the path.
Interaction options:
- Hover to show and click 3 dots menu for Download Data options
Filter tips
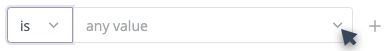
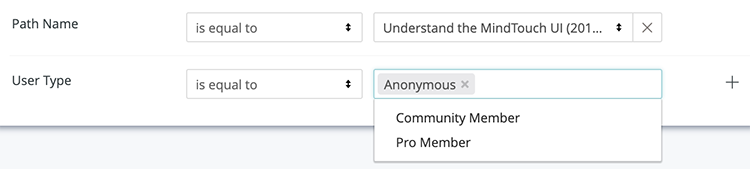
- Auto-suggest: For Path Name and Engagement Channel filters, click into each filter field with is equal to (default) filter type selected to trigger the auto-suggest options before using other filter types.
- Filter field entries: Ensure selected filter field entries are accepted with grey background before clicking reload
. Filter field entries are case sensitive.
Considerations
- The data for this report has been collected since January 1, 2018 and is current through each previous day due to nightly data processing.
- Depending on query size, data may take up to a minute to load. A spinning wheel indicator will appear until each data component loads and the cancel reload button
 will change to the reload button
 when all components complete loading.
- Data settling period: The data for the most recent previous day should be considered incomplete and will likely increase (usually by less than 1%) the following day.
- The report times out after 1 hour of inactivity - refresh browser to reconnect or see 401 error troubleshooting
- Report labels are not localized on non-English Expert sites
- The report service, powered by Looker, has weekly maintenance hours when reports may be unavailable
- Sunday and Wednesday: 4am-6am UTC (9pm-11pm Pacific)