
User Comparison Report
- Applies to:
- MindTouch (current)
- Role required:
- Admin
With the User Comparison report, you can compare how individual contributors are performing on your site. This report can also be filtered by date range and contribution type and visualizes the data so you easily see how users compare. Additionally, you can drill into specific details regarding which articles were impacted by a contribution.
Access User Comparison report
Navigate to Site tools > Dashboard > Contribution Reports > User Comparison.
- The User Comparison report can be accessed by Admins
- The report includes export options to download or email the data.
Report components
Export options
All of the export options can be found in the Dashboard Actions menu
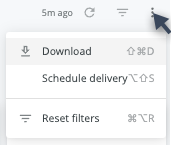
- Download as:
- CSV
- Schedule Delivery (email reports right away or on a schedule)
Filters and Reload
- Date
- User
- Group
- Contribution Type
- Reload

- Show/hide filters

- Reset filters option (located in the Dashboard Actions menu)
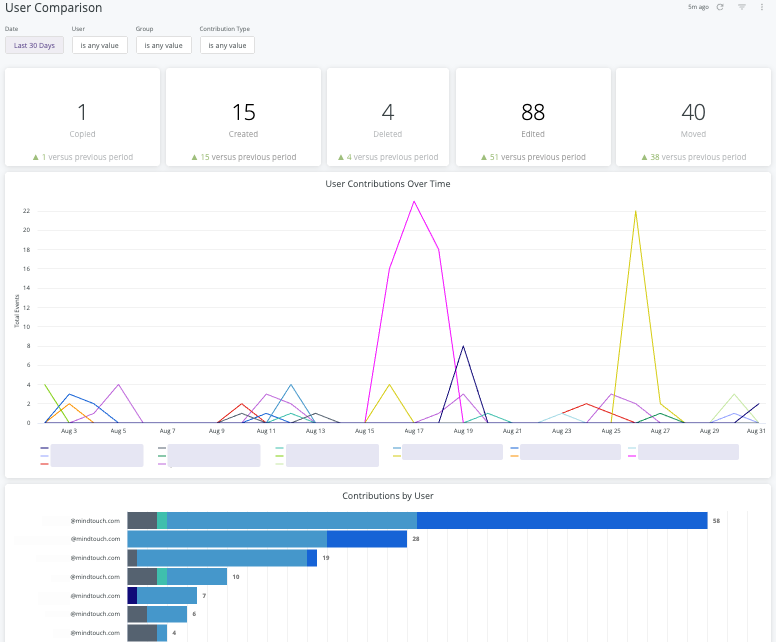
Data
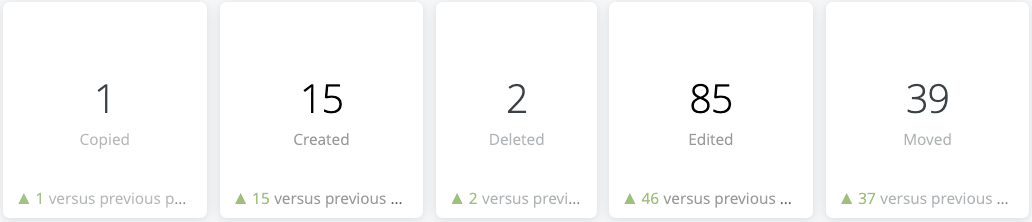
User Comparison Overview
Format: Tiles showing number of Copied, Created, Deleted, Edited, and Moved (totals with comparisons to previous period)
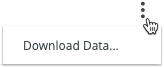
Interaction options:
- Hover over a tile to show and click 3 dots menu for Download Data options
User Contributions Over Time
Format: Line graph
Interaction options:
- Hover over graph to show and click 3 dots menu for Download Data options
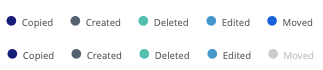
- Click a chart label (username) to toggle each user off or back on in the line graph
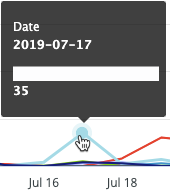
- Hover over any part of the line graph to see a details popup of date and specific value
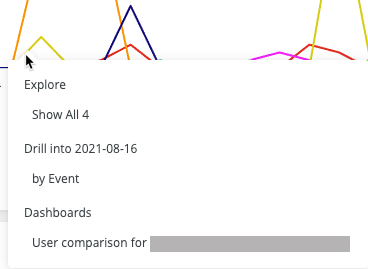
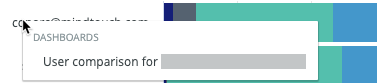
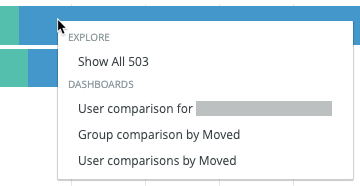
- Click any part of the line graph to see drill options to Explore (popup data table with download option), Drill into Date (popup data table with download option), or Dashboards (refreshes page with relevant user filter applied).
Contributions by user
Format: Bar chart
Interaction options:
- Hover over chart to show and click 3 dots menu for Download Data options
- Click a chart label (username) to see drill option for Dashboards (refreshes report with relevant user filter applied).
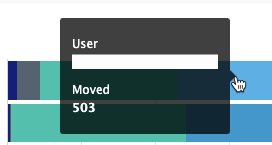
- Hover over any part of the bar chart to see a details popup of user and specific value
- Click any part of the bar chart to see drill options to Explore (popup data table with download option) or Dashboards (refreshes page with relevant filters applied or refreshes page to Group Comparison Report with relevant filters applied).
- Click the chart labels (Copied, Created, Deleted, Edited, Moved) to toggle each contribution type off or back on in the stacked bar chart
Filter tips
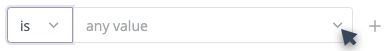
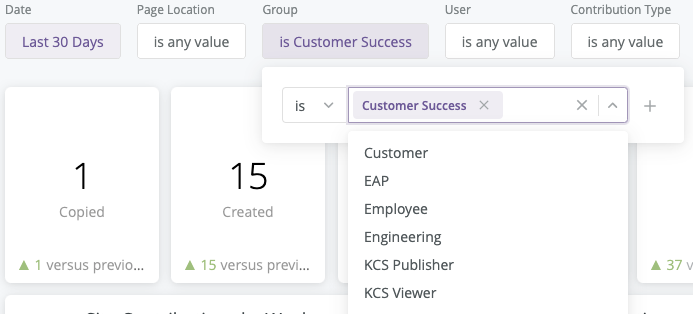
- Auto-suggest: For User, Group, and Contribution Type filters, click into each filter field with is equal to (default) filter type selected to trigger the auto-suggest options before using other filter types.
- A drop-down arrow will appear when the auto-suggest options are available.
- Filter field entries: Ensure selected filter field entries are accepted with grey background before clicking the reload button . Filter field entries are case sensitive
Considerations
- Depending on query size, data may take up to a minute to load. A spinning wheel indicator will appear until each data component loads and the cancel reload button
 will change to the reload button when all components complete loading.
 - Data settling period: The data for the most recent previous day should be considered incomplete and will likely increase (usually by less than 1%) the following day.
- The report times out after 1 hour of inactivity - refresh browser to reconnect or see 401 error troubleshooting
- Report labels are not localized on non-English Expert sites
- The report service, powered by Looker, has weekly maintenance hours when reports may be unavailable
- Sunday and Wednesday: 4am-6am UTC (9pm-11pm Pacific)
The data for this report has been collected since January 1, 2018 and is current through each previous day due to nightly data processing.