Capture Manager Report
- Applies to:
- MindTouch (current)
- Role required:
- Admin
This solution is custom-configured for each client by MindTouch Professional Services. Elements and labels may differ from what is documented.
Capture Manager is designed to enable knowledge creation across an organization, all while improving operational processes and efficiencies. Using Capture Manager, agents and other internal teams can quickly capture and author useful content through a structured authoring process that follows KCS best practices.
This report will allow you to monitor high-level Capture Manager usage among agents across your Expert site:
- Pages created
- Pages updated (edited, deleted, copied, moved)
- Confidence changed
- Governance changed
- Visibility changed
- Flag events (flagged, unflagged)
Access Capture Manager Report
Navigate to Site Tools > Dashboard > Contribution Reports > Capture Manager Report
- The Capture Manager report can be accessed by Admins
- The report includes export options to download or email the data.
Report components
All of the export options can be found in the Dashboard Actions menu
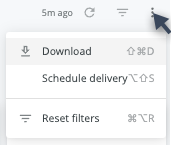
- Download as:
- CSV
- Schedule Delivery (email reports right away or on a schedule)
Filters and Reload
- Date
- Page Location
- User
- Group
- Contribution Type
- Reload

- Show/hide filters

- Reset filters option (located in the Dashboard Actions menu)
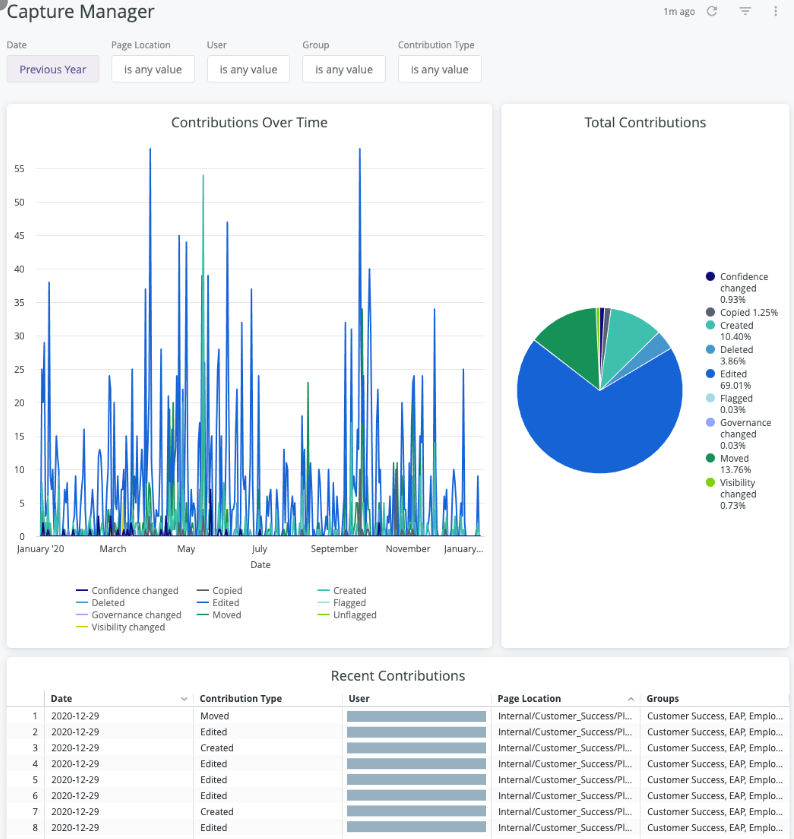
Data
Contributions Over Time
Format: Line graph
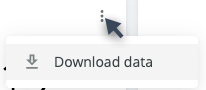
Interaction options:
- Hover over graph to show and click 3 dots menu for Download Data options
- Click the chart labels (Copied, Created, Deleted, Edited, Moved, Confidence changed, Governance changed, Visibility changed, Flagged, Unflagged) to toggle each contribution type off or back on in the line graph
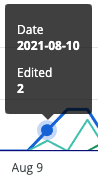
- Hover over any part of the line graph to see a details popup of date and specific value
Total Contributions
Format: Pie chart of Copied, Created, Deleted, Edited, Moved, Confidence changed, Governance changed, Visibility changed, Flagged, Un-flagged
Interaction options:
- Hover over chart to show and click 3 dots menu for Download Data options
- Click the chart labels (Copied, Created, Deleted, Edited, Moved, Confidence changed, Governance changed, Visibility changed, Flagged, Unflagged) to toggle each contribution type off or back on in the pie chart
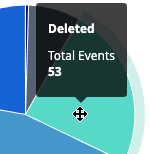
- Hover over any part of the pie chart to see a detailed popup of the contribution type and total number of events.
Recent Contributions
Format: Data table of Date, Contribution Type, User, Page Location, Groups
Interaction options:
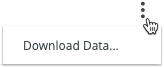
- Click the tiles 3 dots menu for Download Data options
- Click a column label to select it as sort value
- Click the selected label to reverse the sort order
- Click the three dot menu (
 ) next to the column label to open the Column Options menu
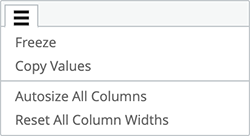
- Freeze: freezes one or more columns to the left side of the table
- Copy Values: copies the column header and all the values in the selected column
- Autosize All Columns: resizes the column widths to fit the column heading name or its longest data value
- Reset All Column Widths: resizes the columns back to their default width
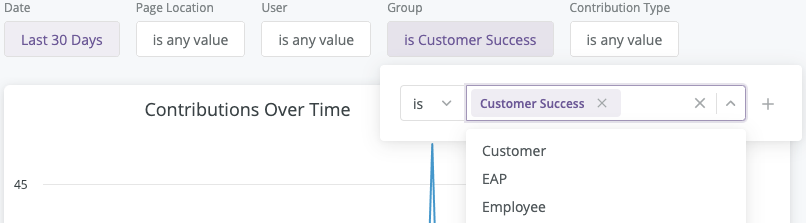
Filter tips
- Auto-suggest: For Page Location, User, Group, and Contribution Type filters, click into each filter field with is equal to (default) filter type selected to trigger the auto-suggest options before using other filter types.
- A drop-down arrow will appear when the auto-suggest options are available.
- Filter field entries: Ensure selected filter field entries are accepted with grey background before clicking the reload button . Filter field entries are case sensitive.